PCA, which stands for Principal Component Analysis, is a widely used statistical method for data analysis. It is a mathematical algorithm that transforms a dataset into a new coordinate system, called the principal components. These components are linear combinations of the original variables and are chosen in such a way that they capture the maximum amount of variation in the data.
One of the main applications of PCA is dimensionality reduction. In many datasets, there are often a large number of variables that are highly correlated with each other. PCA can be used to reduce the dimensionality of the dataset by selecting a smaller set of variables, while preserving the most important information. This can be particularly useful in data visualization and machine learning tasks.
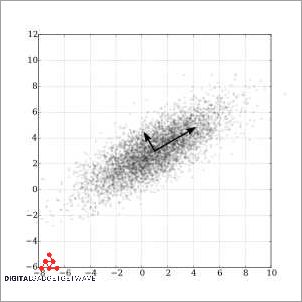
The key idea behind PCA is to find a set of orthogonal eigenvectors, which are the directions in the data that have the greatest variance. These eigenvectors are called the principal components, and the corresponding eigenvalues measure the amount of variance explained by each component. By projecting the data onto these principal components, we obtain a lower-dimensional representation of the data that retains the maximum amount of information.
PCA can be implemented using various algorithms, with the most popular one being the singular value decomposition (SVD). In Python, the scikit-learn library provides a simple and efficient implementation of PCA, making it easy to apply this technique to large datasets. Overall, PCA is a powerful tool in data analysis and can be used to uncover hidden patterns and structures in the data, leading to better insights and decision-making.
Contents
- 1 Understanding PCA
- 2 Practical Applications of PCA
- 3 Limitations of PCA
- 4 FAQ about topic “What Does PCA Stand For? Definition and Examples”
- 5 What is PCA and what does it stand for?
- 6 How does PCA work?
- 7 What are the applications of PCA?
- 8 Can PCA be used for feature selection?
- 9 What are the limitations of PCA?
Understanding PCA
PCA (Principal Component Analysis) is a statistical technique used to transform a set of high-dimensional data into a lower-dimensional space, while still retaining most of the important information. It aims to reduce the dimensionality of the data while maximizing the variance explained by the resulting components.
The basis of PCA is the concept of principal components, which are linear combinations of the original features. These components are orthogonal to each other and are ranked according to the amount of variance they explain in the data. The first principal component explains the most variance, followed by the second, and so on.
The PCA decomposition algorithm computes the eigenvalues and eigenvectors of the data covariance matrix. The eigenvalues represent the amount of variance explained by each principal component, while the eigenvectors define the direction of each component in the original feature space. The eigenvectors with higher eigenvalues have a greater influence on the resulting components.
The scikit-learn library in Python provides an efficient implementation of PCA for dimensionality reduction. By specifying the desired number of components, the algorithm calculates and returns a transformed version of the input data with the reduced number of features. This can be particularly useful when dealing with high-dimensional datasets by simplifying the analysis and visualization.
PCA is based on the linear relationship between the original features. It assumes that the data follows a multivariate normal distribution and that there is a linear correlation between the features. If these assumptions are not met, PCA may not be the most suitable technique for dimensionality reduction.
In conclusion, PCA is a powerful technique for data analysis that allows for the reduction of dimensionality while preserving the most important aspects of the data. By finding the orthogonal directions of highest variance, PCA can simplify complex datasets and reveal underlying patterns and relationships.
What is PCA?
PCA stands for Principal Component Analysis. It is a statistical algorithm used for analyzing data. PCA is a dimensionality reduction technique that transforms a dataset with multiple variables into a smaller set of new variables called principal components.
In PCA, the correlation between different variables is taken into account to find the most important and informative variables. The algorithm calculates the eigenvectors and eigenvalues of the data’s correlation matrix, and then projects the data onto these eigenvectors to obtain the principal components.
PCA is widely used in various fields such as image processing, finance, and genetics. It is particularly useful in the field of multivariate analysis, where datasets have multiple variables and it is necessary to identify the most relevant variables for further analysis.
The main goal of PCA is to reduce the dimensionality of a dataset while preserving as much of the original information as possible. This is done by selecting the principal components that explain the largest amount of variance in the data. By reducing the dimensionality of the data, PCA can help in visualizing and interpreting complex datasets.
PCA is implemented in several programming languages and libraries, such as scikit-learn in Python. It is also often used as a preprocessing step in machine learning algorithms to reduce the dimensionality of the input data and improve computational efficiency.
How does PCA work?
PCA, or Principal Component Analysis, is an algorithm used for data analysis and dimensionality reduction. It is implemented in various libraries, such as scikit-learn, and is widely used in the field of statistics and data analysis.
PCA works by finding the principal components of a given dataset. These components are linear combinations of the original variables, calculated in such a way that they capture the maximum amount of variance in the data. The first principal component is the one that explains the most variance, the second component explains the most variance that is orthogonal to the first, and so on.
The principal components are obtained by performing an eigenvalue decomposition of the covariance matrix or singular value decomposition of the data matrix. The resulting eigenvectors, or principal axes, represent the directions in the original variable space along which the data varies the most. The corresponding eigenvalues indicate the amount of variance explained by each principal component.
During the PCA process, the original variables are transformed into a new set of variables, called the principal components. These components are orthogonal, meaning that they are uncorrelated with each other. This transformation allows for a reduction in the dimensionality of the data, as the most important information is captured in a smaller number of components.
PCA can be used for various purposes, such as data visualization, feature extraction, or noise reduction. It is particularly useful in cases where there are many variables in a dataset, as it allows for a more concise representation of the data and can reveal underlying patterns and relationships.
Benefits of using PCA
One of the main benefits of using PCA (Principal Component Analysis) is its ability to analyze multivariate data by projecting it onto a lower-dimensional subspace. This decomposition of the data allows for a more concise representation of the underlying relationships and patterns.
PCA computes the eigenvectors and eigenvalues of the covariance matrix of the dataset, which provide information about the directions of maximum variance. By selecting only the top components with the highest eigenvalues, we can reduce the dimensionality of the data without losing important information.
The principal components obtained from PCA can be extremely useful for data visualization and feature extraction. They capture the most significant correlations within the dataset and can be used in subsequent analysis or machine learning algorithms.
One of the key advantages of PCA is that it is a linear transformation. This makes it computationally efficient and easy to interpret the results. The transformed data can be easily interpreted in terms of the original variables, aiding in the understanding of the underlying statistical relationships.
PCA is widely supported by various software libraries and frameworks, such as scikit-learn in Python. This allows for easy implementation and integration into existing analytical workflows.
In addition to dimensionality reduction, PCA can also be used for data compression and noise reduction. By selecting a subset of the principal components, we can compress the data while retaining most of the important information. Similarly, by removing the components associated with noise, we can enhance the signal-to-noise ratio in the data.
In summary, PCA offers several benefits in the field of data analysis and statistics. It provides a powerful tool for dimensionality reduction, data visualization, feature extraction, and noise reduction. Its linear and efficient nature, along with the availability of software implementations, makes it a popular choice for a wide range of applications.
Practical Applications of PCA
Linear dimensionality reduction: One of the most common practical applications of PCA is linear dimensionality reduction. PCA is used to reduce the dimensionality of high-dimensional data by projecting it onto a lower-dimensional subspace. This is useful in various domains, such as image processing, where high-dimensional image data can be efficiently represented and analyzed using a lower number of principal components.
Multivariate statistics: PCA is widely used in multivariate statistics for analyzing the correlation and covariance structure of high-dimensional data. It helps in identifying patterns, trends, and relationships among different variables. By representing data in a lower-dimensional space, PCA can simplify the analysis and interpretation of complex multivariate datasets.
Signal processing: PCA is used in signal processing for noise reduction and signal denoising. By capturing the principal components of a signal, PCA can effectively separate the signal from the noise. This technique is commonly used in applications like speech recognition, image denoising, and audio processing.
Pattern recognition: PCA is also applied to pattern recognition tasks, where it helps in feature extraction and classification. By transforming the original data into a lower-dimensional space, PCA focuses on the most informative features, discarding irrelevant or redundant information. This can improve the performance of machine learning algorithms by reducing the computational complexity and improving the accuracy of classification.
Data visualization: PCA is often used for visualizing high-dimensional data in a lower-dimensional space. By projecting data onto a few principal components, PCA enables the representation of complex datasets in two or three dimensions. This allows for the visualization and exploration of data in a more intuitive and interpretable way. Tools like scikit-learn provide efficient implementations of PCA that can be used for data visualization and exploration.
Biological data analysis: PCA has found applications in various fields of biology, such as genomics, proteomics, and neuroscience. It is used to analyze large-scale biological datasets, identify important features, and study the relationships between different biological variables. PCA can help in interpreting complex biological data and discovering underlying patterns, which can lead to new insights and discoveries in the field.
Eigenvector-based analysis: PCA is based on the eigenvector decomposition of the covariance matrix of the input data. This eigenvector-based analysis can be applied to various domains, such as finance, engineering, and social sciences. PCA can help in identifying the main factors contributing to the variance in a dataset and analyzing the impact of different variables on the overall structure of the data.
Dimensionality reduction for machine learning: PCA is widely used for dimensionality reduction in machine learning tasks. By reducing the dimensionality of the input data, PCA can improve the performance and efficiency of machine learning algorithms. It helps in reducing the risk of overfitting, improving the interpretability of the models, and reducing the computational complexity of training and inference.
Overall, PCA has a wide range of practical applications in various fields, including data analysis, signal processing, pattern recognition, and machine learning. It provides a powerful tool for analyzing and interpreting high-dimensional data, reducing dimensionality, and extracting important features. By capturing the most informative components in the data, PCA can help in understanding complex datasets and making better decisions based on the underlying patterns and relationships.
PCA in image processing
PCA, or Principal Component Analysis, is a dimensionality reduction technique commonly used in image processing. It is a statistical analysis method that aims to transform a set of variables, in this case, pixel values, into a new set of uncorrelated variables called principal components. It is often used to reduce the dimensionality of high-dimensional image data, capturing the most important features or patterns.
In image processing, PCA can be used for various purposes. One of the main applications is image compression. By applying PCA, the high-dimensional image data can be projected into a lower-dimensional space while preserving most of the important information. This reduction in dimensionality can significantly reduce the storage space required for the image without compromising its quality.
The process of PCA involves calculating the covariance matrix of the image data, which represents the correlation between pixel values. From the covariance matrix, the eigenvalues and eigenvectors are computed. The eigenvectors, or principal components, represent the directions of maximum variance in the data. These components are orthogonal to each other and can be ranked based on their corresponding eigenvalues, which indicate the amount of variance captured by each component.
Scikit-learn, a popular machine learning library in Python, provides an implementation of PCA that can be easily used for image processing tasks. By specifying the desired number of principal components, the PCA algorithm can automatically perform the dimensionality reduction process. The resulting transformed data can then be used for further analysis or visualization.
In conclusion, PCA is a crucial technique in image processing for dimensionality reduction and feature extraction. By applying PCA, it is possible to transform high-dimensional image data into a lower-dimensional representation while preserving the important information. This can lead to more efficient storage and analysis of image data, as well as improved performance in various image processing tasks.
PCA in finance
In finance, PCA stands for Principal Component Analysis, a multivariate statistical algorithm used for dimensionality reduction of financial data. PCA is commonly used in finance to transform a large set of correlated variables into a smaller set of uncorrelated variables, called principal components. This reduction in dimensionality helps in analyzing and visualizing complex financial data.
The PCA algorithm works by finding the eigenvalues and eigenvectors of the covariance matrix of the input data. The eigenvalues represent the amount of variance explained by each principal component, while the eigenvectors determine the directions of these components in the original data space. By choosing the principal components with the highest eigenvalues, one can capture the most important information in the data.
In finance, PCA can be applied to various financial data sets, such as stock prices, interest rates, or economic indicators. It can be used to identify hidden patterns, perform risk analysis, and optimize portfolio allocation strategies. For example, a financial analyst can use PCA to reduce the dimensionality of a stock price dataset and identify the main factors driving the price movements.
The implementation of PCA in finance often involves the use of statistical libraries, such as scikit-learn in Python. These libraries provide pre-built functions and tools for performing PCA, calculating eigenvalues and eigenvectors, and visualizing the results. With the help of these libraries, financial analysts and researchers can easily apply PCA to their data and extract meaningful insights.
In conclusion, PCA is a powerful tool in finance for dimensionality reduction and analysis of complex financial data. By transforming the data into a set of uncorrelated principal components, PCA helps in understanding the underlying structure and relationships in the data, making it an invaluable tool in financial analysis and decision-making.
PCA in genetics
PCA (Principal Component Analysis) is a statistical algorithm widely used in genetics to analyze genetic data and understand the relationship between individuals or populations. It allows for the reduction of the dimensionality of data by transforming the original variables into a new set of uncorrelated variables called principal components.
In genetics, PCA can be applied to a variety of data types, such as genotype or gene expression data. It is particularly useful when dealing with high-dimensional data, as it can effectively capture the most important features and patterns in the data while reducing noise and redundancy.
The main concept behind PCA is to find the linear projection that maximizes the variance in the data. This projection is achieved by identifying the principal components, which are the eigenvectors of the correlation or covariance matrix of the data.
By analyzing the eigenvalues associated with each principal component, one can determine their importance in explaining the variation in the data. The first principal component explains the largest amount of variance, followed by the second, and so on. This allows for the identification of the most influential components.
PCA can be implemented in genetics using various software packages, such as scikit-learn, which provides efficient and easy-to-use functions for PCA analysis. The results obtained from PCA can provide valuable insights into genetic relationships, population structure, and the underlying genetic architecture of complex traits.
Limitations of PCA
While Principal Component Analysis (PCA) is a widely used algorithm for dimensionality reduction and data analysis, it has some limitations that need to be considered:
- Linear Transformation: PCA is a linear algorithm that assumes linearity in the data. This means that it may not be able to capture non-linear relationships well and may not be suitable for datasets with non-linear patterns.
- Lack of Interpretability: Although PCA provides a way to transform data into a new set of variables, known as principal components, these components may not have a clear and intuitive interpretation. Therefore, understanding the meaning of each component can be challenging.
- Correlation Dependency: PCA is based on the assumption that highly correlated variables can be represented by a smaller number of new uncorrelated variables. However, if the dataset contains variables that are not linearly correlated, PCA may not effectively summarize the information.
- Orthogonality Assumption: PCA assumes that the principal components are orthogonal to each other, meaning that they are uncorrelated. However, in some cases, the assumption of orthogonality may not hold true, leading to potential issues in accurately capturing the variance within the data.
- Eigenvalues and Eigenvalues: PCA relies on the eigenvalues and eigenvectors of the covariance matrix to calculate the principal components. If the dataset has a large number of variables or if the eigenvalues are close to zero, PCA may become less reliable in capturing the most important features of the data.
- Data Scaling: PCA is sensitive to the scale of the data. If the features in the dataset have significantly different scales, PCA may prioritize the features with larger variances, leading to biased results. Therefore, it is important to scale the data before applying PCA.
- Loss of Information: While PCA aims to reduce the dimensionality of the data, it may also result in the loss of some information. As the original features are combined to form the principal components, some details may be dropped, potentially leading to a loss of interpretability in the analysis.
Overall, PCA can be a valuable tool for dimensionality reduction and data analysis, but it is important to be aware of its limitations and consider alternative methods when dealing with datasets that do not meet the assumptions of the algorithm.
Sensitivity to outliers
Principal Component Analysis (PCA) is a dimensionality reduction technique that is widely used in statistics and data analysis. It aims to transform a dataset into a lower-dimensional space while preserving the most important information. However, PCA can be sensitive to outliers present in the data.
Outliers are extreme values that differ significantly from the other data points. In the context of PCA, outliers can have a strong influence on the calculation of the principal components. The principal components are the dimensions along which the data varies the most, and they are determined by the eigenvalues and eigenvectors of the covariance matrix.
When outliers are present, they can distort the covariance matrix and impact the calculation of the principal components. The presence of outliers can lead to biased estimations of the principal components and can affect the interpretation of the results. These outliers can create noise in the data and mask the true underlying structure of the dataset, leading to misleading conclusions.
There are several techniques available to address the sensitivity of PCA to outliers. One approach is to use robust PCA algorithms, which are designed to be less affected by outliers. These algorithms employ robust statistical measures that are less influenced by extreme values.
In addition, preprocessing the data by removing outliers or transforming the data in a way that reduces their impact can also help to mitigate the sensitivity to outliers. Techniques such as Winsorizing or truncation can be used to replace extreme values with values within a certain range.
Overall, it is important to be aware of the sensitivity of PCA to outliers and to take appropriate steps to handle them in the analysis. By doing so, more accurate and reliable results can be obtained from PCA, leading to better insights and understanding of the underlying data patterns.
Interpretability challenges
One of the challenges in interpreting the results of PCA is understanding the algorithm itself. PCA is a linear dimensionality reduction technique that aims to find a lower-dimensional representation of the data that captures the most important information. The algorithm computes the eigenvectors and eigenvalues of the covariance matrix of the data, which are used to determine the principal components.
Another challenge lies in interpreting the transformed data after applying PCA. The transformed data is obtained by projecting the original data onto the principal components. These principal components are orthogonal to each other, meaning they are uncorrelated, and capture the maximum variance of the data. However, understanding how the original features relate to the principal components can be difficult.
Furthermore, interpreting the significance of each principal component can be challenging. The eigenvalues associated with each principal component indicate the amount of variance in the data explained by that component. However, determining which principal components are most important and how they relate to the original features is not always straightforward.
The interpretation of PCA results can also be influenced by the choice of number of components to retain. In some cases, retaining too few components may lead to a loss of important information, while retaining too many components can result in overfitting the data. Therefore, determining the optimal number of components to retain requires careful consideration and possibly further statistical analysis.
Overall, interpreting the results of PCA involves understanding the algorithm, the transformed data, the significance of each component, and the number of components to retain. It often requires domain knowledge and a deeper understanding of multivariate statistics and linear algebra. Further visualizations and additional statistical techniques can be used to aid in the interpretation of PCA results.
Assumptions and limitations
Principal Component Analysis (PCA) is a widely used technique in statistics and data analysis. However, it is important to note that PCA makes several assumptions, and there are certain limitations to its applicability.
Firstly, PCA assumes that the variables in the dataset are linearly related to each other. This means that PCA is most effective when the relationships between the variables can be expressed as simple linear equations. If the relationships are non-linear, PCA may not accurately capture the underlying structure of the data.
Another assumption of PCA is that the variables have a multivariate normal distribution. This means that the variables in the dataset should be normally distributed and there should be no extreme outliers. If the data violates this assumption, the results of PCA may be skewed.
PCA also assumes that the data has a sufficiently large sample size. The algorithm performs a decomposition of the data matrix using eigenvalues and eigenvectors, and requires a certain number of observations to accurately estimate these values. If the sample size is too small, the results of PCA may not be reliable.
Additionally, PCA is a dimensionality reduction technique, and as such, it can only capture a certain amount of variance in the data. The number of components retained in the analysis determines the amount of variance explained. It is important to consider the trade-off between dimensionality reduction and the amount of variance retained.
Furthermore, PCA assumes that the variables are orthogonal to each other. This means that there should be no significant correlation between the variables. If there is a high degree of correlation, PCA may not effectively identify the underlying structure of the data.
Overall, while PCA is a powerful tool for dimensionality reduction and data analysis, it is important to be aware of its assumptions and limitations. Care should be taken when applying PCA, and it is advisable to consider alternative methods and tools, such as those available in scikit-learn, for data analysis and exploration.
FAQ about topic “What Does PCA Stand For? Definition and Examples”
What is PCA and what does it stand for?
PCA stands for Principal Component Analysis. It is a statistical technique used to reduce the dimensionality of large datasets while retaining most of the variability present in the data.
How does PCA work?
PCA works by finding the linear combinations of the original variables that explain the maximum amount of variance in the data. These linear combinations are called principal components.
What are the applications of PCA?
PCA is widely used in various fields such as image processing, genetics, finance, and social sciences. It can be applied to reduce the dimensionality of high-dimensional data, remove noise from signals, or visualize complex datasets.
Can PCA be used for feature selection?
Yes, PCA can be used for feature selection. By identifying the principal components that contribute the most to the total variance in the data, PCA can help in selecting the most important features.
What are the limitations of PCA?
The main limitation of PCA is that it is a linear method, and may not work well with non-linear relationships in the data. Additionally, PCA does not guarantee interpretability of the principal components, and the selected components may not always have a clear meaning in the context of the data.